English worked example · Published 22 October 2026 · Original educational example
The cheaper mould can cost more: compare tooling over real order quantities
You have two acceptable manufacturing proposals. One asks for less tooling money but more per part; the other reverses that trade-off. Dividing the tool by a large sales forecast makes both look inexpensive. The more useful question is: how much would each route cost at the quantities you might actually buy?
This tutorial builds a comparison that separates the first order, repeat-batch costs and lifetime allocation. You can reproduce every number with a basic calculator or the attached offline worksheet. No CAD or moulding machine is needed.
All prices and quantities below are invented teaching assumptions. They are not Nordmould offers, industry averages, customer results or evidence that either tool design can make your part. No tool metal, cavity count or manufacturing process improvement is implied by the labels A and B.
1. Put both proposals on the same basis
Use the same drawing revision, material, accepted-part requirements, inspection, packing and delivery scope. Write down any differences before comparing the prices. If a supplier quotes gross production rather than accepted parts, resolve that difference first; do not quietly divide by a larger denominator.
For our example, both options deliver equivalent accepted parts. The recurring price includes material and moulding. Each production batch has a separate setup charge. Tooling is paid in full for the first order. We exclude VAT, shipping, financing, storage, maintenance, extra inspection, design changes and disposal. Real proposals must state which of those apply.
2. Build the total-cost equation
Let F be tooling, u the recurring accepted-part price, Q the accepted quantity, S the setup charge and n the actual number of setups.
Total cost = F + u × Q + S × n
Average cost per accepted part = Total cost ÷ Q
For our assumed order pattern, n = ceiling(Q ÷ 1,000): every started batch incurs a full setup. A quantity of 1,001 would therefore require two setups in this example. This is an order-planning assumption, not a physical production rule or a supplier minimum. Enter your actual batch plan if the orders are irregular or a supplier combines them.
At 1,000 parts, A costs 4,800 + 0.90 × 1,000 + 180 = EUR 5,880. B costs 10,800 + 0.50 × 1,000 + 240 = EUR 11,540. A needs EUR 5,660 less for this assumed first order.
3. Compare several useful quantities
Do not stop at one lifetime forecast. Compare the first order, a conservative demand case and a larger programme that may or may not happen.
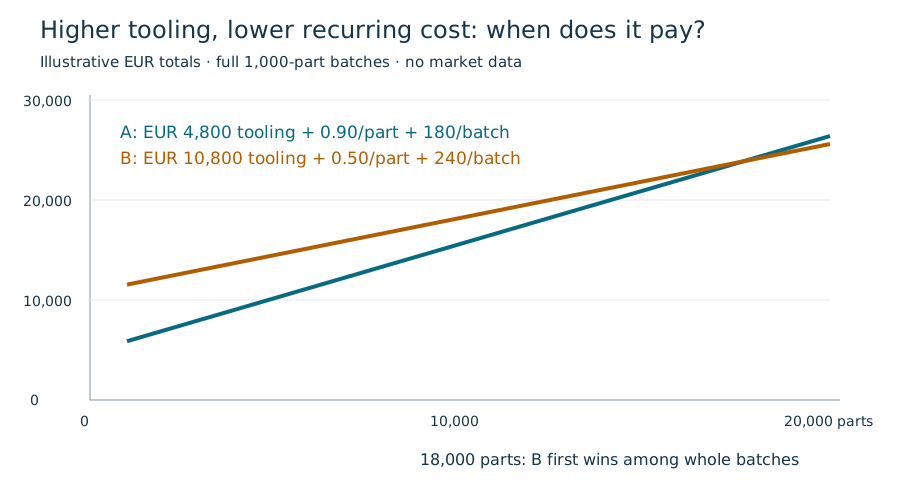 Original schematic from the stated assumptions. Full-batch comparison points; not observed manufacturing prices.
At 10,000 parts, A is EUR 2,600 lower. At 20,000, B is EUR 800 lower. The answer changes with demand. It also changes if the recurring quote or the production-batch pattern changes.
4. Find break-even without forgetting setup
B asks for EUR 6,000 more tooling and saves EUR 0.40 per part before setup. Ignoring setup gives 6,000 ÷ 0.40 = 15,000 parts. But B's setup costs EUR 60 more each time.
For complete 1,000-part batches, that extra setup is EUR 0.06 per part. B therefore saves EUR 0.34 per part after setup, giving the continuous full-batch equivalent:
(10,800 − 4,800) ÷ [(0.90 + 180/1,000) − (0.50 + 240/1,000)]
= 6,000 ÷ 0.34 ≈ 17,647 parts
You cannot buy 17.647 complete batches. Compare the allowed full-batch choices: at 17,000 parts A costs EUR 23,160 and B EUR 23,380; at 18,000, A costs EUR 24,240 and B EUR 24,120. B first wins at the eighteenth full batch. For partial batches, use the original total-cost equation rather than this continuous shortcut. With 18 setups, the two totals are exactly equal at 17,700 parts (EUR 23,970 each); B is lower above 17,700 parts within that batch interval. The 18,000-part result refers specifically to complete 1,000-part batches. A general positive break-even does not exist if the higher-fixed-cost option never saves on equivalent recurring cost.
5. Keep the first-order budget separate from lifetime allocation
Allocation means spreading a fixed tool cost over a quantity for analysis; it does not change the payment terms. At a 20,000-part lifetime allocation, A averages EUR 1.32 per part and B EUR 1.28. That does not make the first 1,000 parts payable at EUR 1,320 or EUR 1,280. Under our full-upfront-tooling assumption, the first-order budgets remain EUR 5,880 and EUR 11,540.
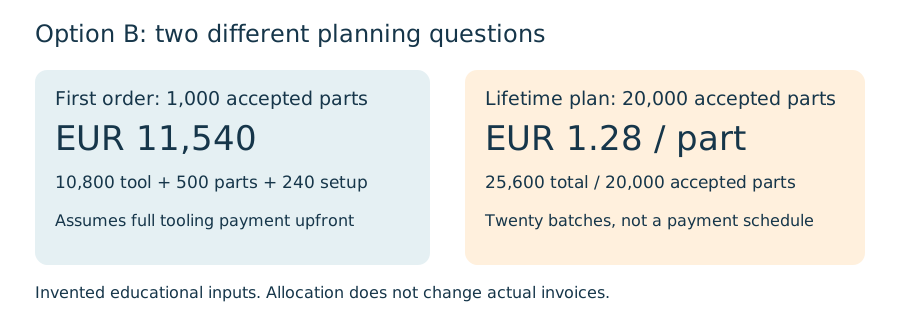 Allocation spreads a fixed cost in your analysis; it does not change the supplier's payment terms.
Ask for deposits and payment milestones separately. Even an option with a lower eventual total can be harder to fund today. If a design revision ends the programme after 5,000 parts, unused forecast volume cannot recover the tool premium. This simple undiscounted model does not price financing, the time value of money or probabilities of future orders.
6. Test what could change the decision
- Smaller batches: at 20,000 parts in forty 500-part batches, A totals EUR 30,000 and B EUR 30,400. A becomes lower because setup is incurred more often.
- Lower demand than forecast: at 5,000 parts in five batches, A costs EUR 10,200 and B EUR 14,500. Keep the demand case tied to the current drawing revision.
- Different included work: add a required fixture or extra qualification to the option that actually needs it. Do not hide a known fixed charge inside a vague unit-price allowance.
- Capacity and quality: the lower calculated total does not demonstrate that a process meets tolerances, delivery needs or acceptance criteria. Confirm those independently.
7. Replace the assumptions with a written quotation
Save the drawing revision, material, accepted quantity, batch plan, unit-price scope, tooling deliverables, setup charges, exclusions, ownership and maintenance terms beside the numbers. Confirm that any recurring quote already includes the losses or allowances you intend to add, so you do not count them twice.
The attached offline worksheet lets you edit the two options and compare planned quantities without sending data anywhere. For an optional material-and-machine-time breakdown, Nordmould's part-cost calculator provides a separate budget model. Its percentage allowance applies to the complete subtotal, including tooling allocation; it does not model this article's separate setup schedule. This article compares equivalent supplier proposals; the calculator builds a rough budget from process assumptions. Neither validates the other. Do not paste a selling price into a raw-material field or expect the two models to produce the same number.
Method, sources and attribution
All euro values, quantities, scenarios, equations and diagrams in this tutorial were created for this educational example. Calculations use unrounded values and display euros to two decimals where useful. The worksheet uses the same F + uQ + Sn model.
For manufacturing context, Protolabs' tooling-cost guidance describes tooling allocation across quantity and geometry/finish as cost factors. That source does not substantiate our invented euro inputs or any Nordmould capability. Source checked 22 October 2026.
Prepared by Nordmould, a manufacturing project coordinator. Reviewed 22 October 2026 using independent arithmetic checks, automated technical/editorial review and browser checks of the worksheet. This is an educational cost model, not a validated mould design or independent engineering certification.
Tooling cost guide · Part-cost calculator · Privacy